Post your Resource Consumption at Idle

munkyeetr

New Member
Last night I traded in my dual-booting Ubuntu and Fedora 7 setup for a single installation of Debian 4. When I was done installing I wanted to see my base resource consumption and was quite pleased (and surprised) by the results.

I thought it might be fun to compare different people setups and operating systems and how they hold their own in this respect.

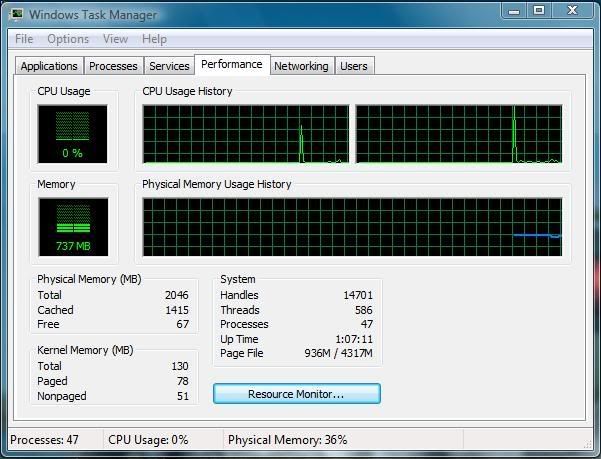
So, my screen-shot is taken immediately after a reboot, and I haven't opened any programs other than the System Monitor, and she's idling at a cool 79.9 MB

4ziy9n7.jpg
 
Code:
 PID USER      PR  NI  VIRT  RES  SHR S %CPU %MEM    TIME+  COMMAND
 5457 tlarkin   15   0  8608 1232  900 R  0.3  0.1   0:00.07 top
    1 root      15   0   808  304  244 S  0.0  0.0   0:01.34 init
    2 root      RT   0     0    0    0 S  0.0  0.0   0:00.00 migration/0
    3 root      34  19     0    0    0 S  0.0  0.0   0:00.00 ksoftirqd/0
    4 root      10  -5     0    0    0 S  0.0  0.0   0:00.10 events/0
    5 root      10  -5     0    0    0 S  0.0  0.0   0:00.01 khelper
    6 root      10  -5     0    0    0 S  0.0  0.0   0:00.00 kthread
   10 root      10  -5     0    0    0 S  0.0  0.0   0:00.00 kblockd/0
   11 root      10  -5     0    0    0 S  0.0  0.0   0:00.00 kacpid
   12 root      20  -5     0    0    0 S  0.0  0.0   0:00.00 kacpi_notify
   99 root      20  -5     0    0    0 S  0.0  0.0   0:00.00 cqueue/0
  100 root      13  -5     0    0    0 S  0.0  0.0   0:00.00 kseriod
  144 root      25   0     0    0    0 S  0.0  0.0   0:00.00 pdflush
  145 root      15   0     0    0    0 S  0.0  0.0   0:00.01 pdflush
  146 root      10  -5     0    0    0 S  0.0  0.0   0:00.01 kswapd0
  147 root      20  -5     0    0    0 S  0.0  0.0   0:00.00 aio/0
  391 root      15  -5     0    0    0 S  0.0  0.0   0:00.00 kpsmoused
 
here is my G5 at work

Code:
Processes:  51 total, 2 running, 49 sleeping... 178 threads            13:11:38
Load Avg:  0.20, 0.08, 0.04     CPU usage:  3.6% user, 4.2% sys, 92.2% idle
SharedLibs: num =  137, resident = 25.1M code, 3.17M data, 6.45M LinkEdit
MemRegions: num =  3634, resident = 37.2M + 8.23M private, 31.9M shared
PhysMem:  68.1M wired, 58.5M active, 74.3M inactive,  200M used,  823M free
VM: 3.52G + 89.4M   10148(6) pageins, 0(0) pageouts

  PID COMMAND      %CPU   TIME   #TH #PRTS #MREGS RPRVT  RSHRD  RSIZE  VSIZE
  248 top          3.0%  0:00.25   1    18    22   420K+  388K  2.21M+ 27.0M 
  247 bash         0.0%  0:00.01   1    14    16   176K   836K   816K  27.2M
  246 login        0.0%  0:00.01   1    16    36   148K   404K   572K  26.9M
  244 mdimport     0.0%  0:00.16   3    61    46   756K  1.77M  2.30M  38.4M
  243 Terminal     6.0%  0:00.67   4    92   106  1.54M+ 6.05M+ 5.91M+  149M 
  237 automount    0.0%  0:00.02   3    41    29   308K   856K  1.05M  28.7M
  233 automount    0.0%  0:00.03   3    43    33   304K   896K  1.09M  29.0M
  230 rpc.lockd    0.0%  0:00.00   1    10    16    88K   372K   196K  26.7M
  221 nfsiod       0.0%  0:00.00   5    30    24   124K   316K   184K  28.6M
  207 ntpd         0.0%  0:00.02   1    11    18   152K   520K   372K  26.9M
  193 lookupd      0.0%  0:00.04   2    34    38   384K   944K  1.13M  28.5M
  191 mdimport     0.0%  0:00.18   3    61    46   768K  1.94M  2.30M  38.4M
  185 UserNotifi   0.0%  0:00.49   2    91    87  1.23M  4.33M  4.09M   145M
  153 OpenBase     0.0%  0:00.17   4    37    51  1.12M  2.08M  2.78M  41.2M
  151 OpenBase     0.0%  0:00.18   4    53    51  1.14M  2.08M  2.80M  41.2M
  149 OpenBase     0.0%  0:00.21   4    37    51  1.21M  2.08M  2.88M  41.2M
 
no screenshot because im off to bed lol:)

XP

Used: 508Mb
Free:770Mb

nice to see Ubuntu doesnt use much :)
 
Back
Top