You are using an out of date browser. It may not display this or other websites correctly.
You should upgrade or use an alternative browser.
You should upgrade or use an alternative browser.
|Official|Black Hole: Benchmark Ranking thread
- Thread starter Virssagòn
- Start date
Virssagòn
VIP Member
I would recommend posting the leaderboard about 25% smaller")
next time ok?

wolfeking
banned
I'll do it for you my friend
edit: I updated it to zip
thanks. Scores here.
Virssagòn
VIP Member
thanks. Scores here.
Nice scores!!
I'll post mine this evening, I'm very busy today...

Okedokey
Well-Known Member
Bigfella, I like the design style of the new graphs, and thanks for taking the time to do the other graph regarding the correlation between clockspeed and scores too. Much appreciated!
I see a new version has been released - I'll try it out!")
Thanks man, i was going to try and make the same cpus the same colour, but then i cbf.
With this new version...
Boys why not just the display the score in the same metric as before? If you continue to change it, the whole things becomes meaningless
Last edited:
I agree with you Bigfella - Smile wrote this one as I out pretty much all day yesterday.
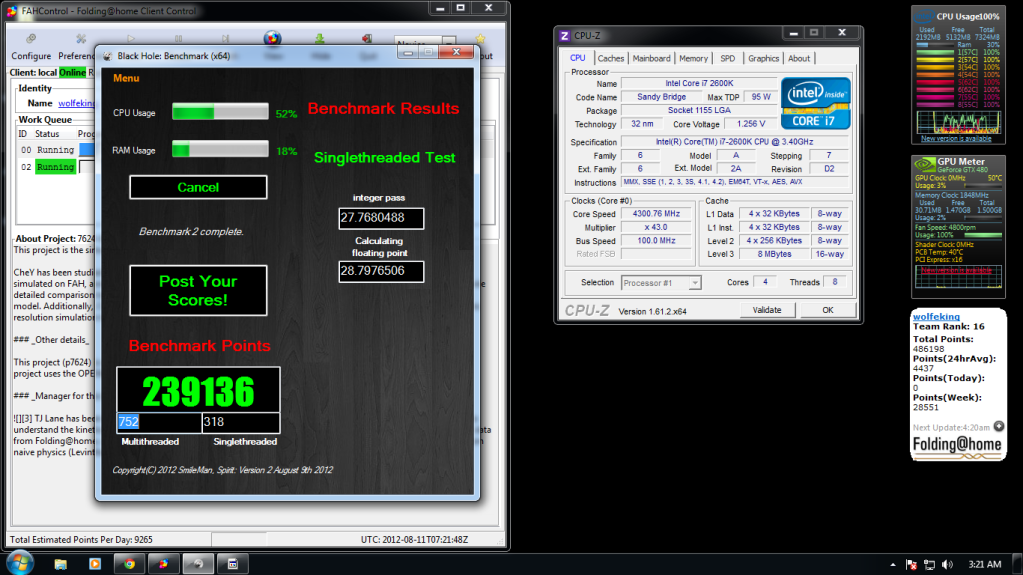
OK so here are my scores - i5 2500K oc'ed to 4.3GHz as per the usual.
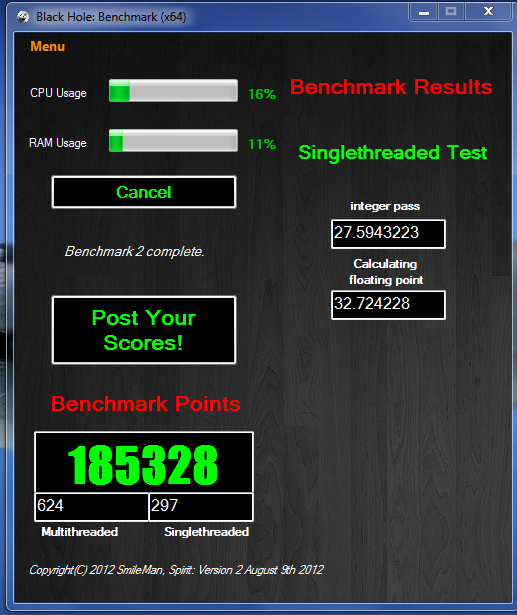
One thing I did notice was when you run the Single-Threaded test it spreads the load out between each core, it is not maxing out one thread/core like it presumably should be doing. The Multi-Threaded bench maxed all cores out though.
As for name suggestions - Viper Bench, Fury Bench? Something like that?
OK so here are my scores - i5 2500K oc'ed to 4.3GHz as per the usual.
One thing I did notice was when you run the Single-Threaded test it spreads the load out between each core, it is not maxing out one thread/core like it presumably should be doing. The Multi-Threaded bench maxed all cores out though.
As for name suggestions - Viper Bench, Fury Bench? Something like that?
Virssagòn
VIP Member
I agree with you Bigfella - Smile wrote this one as I out pretty much all day yesterday.
OK so here are my scores - i5 2500K oc'ed to 4.3GHz as per the usual.
One thing I did notice was when you run the Single-Threaded test it spreads the load out between each core, it is not maxing out one thread/core like it presumably should be doing. The Multi-Threaded bench maxed all cores out though.
As for name suggestions - Viper Bench, Fury Bench? Something like that?
Thats normal, every cpu spread his work over the cores.
But that doesn't matter in scores I noticed.
Bigfella, I'm working on a design which I gonna use almost forever if it's done.
The metric is just the same as the previous, only the design is a bit different.
I reduced all the information by putting it in a menu.
And I like it now more as before. But thanks for your suggestion.
ty, btw, nice benchmark table. But maybe let the score start at 4500 points or something so you can see the difference.
Also a nice idea to give the same color to the same cpu!
wolfeking
banned
BS! The metric is not the same. Running for 9k is not the same thing as running for 300,000.The metric is just the same as the previous, only the design is a bit different.
Virssagòn
VIP Member
BS! The metric is not the same. Running for 9k is not the same thing as running for 300,000.
aah, I thought you were meaning the metric of the benchmark itself
I'll try to give it same results as before. But I fixed the score system from previous version, because if you had a too slow cpu, you had 0 points. Now thats fixed, but this is only the preview version. The v1.1 is still the official one.
Virssagòn
VIP Member
I know its a preview. We are trying to help you make it better.
yeah, thanks for that. But you like the design already?
I placed all info in the menu so it doesn't looks too informatif
Virssagòn
VIP Member


Virssagòn
VIP Member
You should check the code on Phenom II's. Mine keeps getting different results with no changes in my computer. It's been as low as 3000 and up to 5300. I did it twice this morning and got 49xx each time.
hmm, yeah. I asked someone already to test his phenom 955, but he doesn't respond. But I see the other phenom in the benchmark is doing well....
btw: I have upped my ram a bit and got 10 points more again

